Reading your analytics
What every number on the Analytics page means, and how to use it to make your deals sell more.
The Analytics page shows how your deals are doing. Sales come from your real BigCommerce orders, in your store currency, and update within about five minutes of each order.
At a glance: the Overview page
The Overview page — the first thing you see when you open the app — sums up the last 30 days:
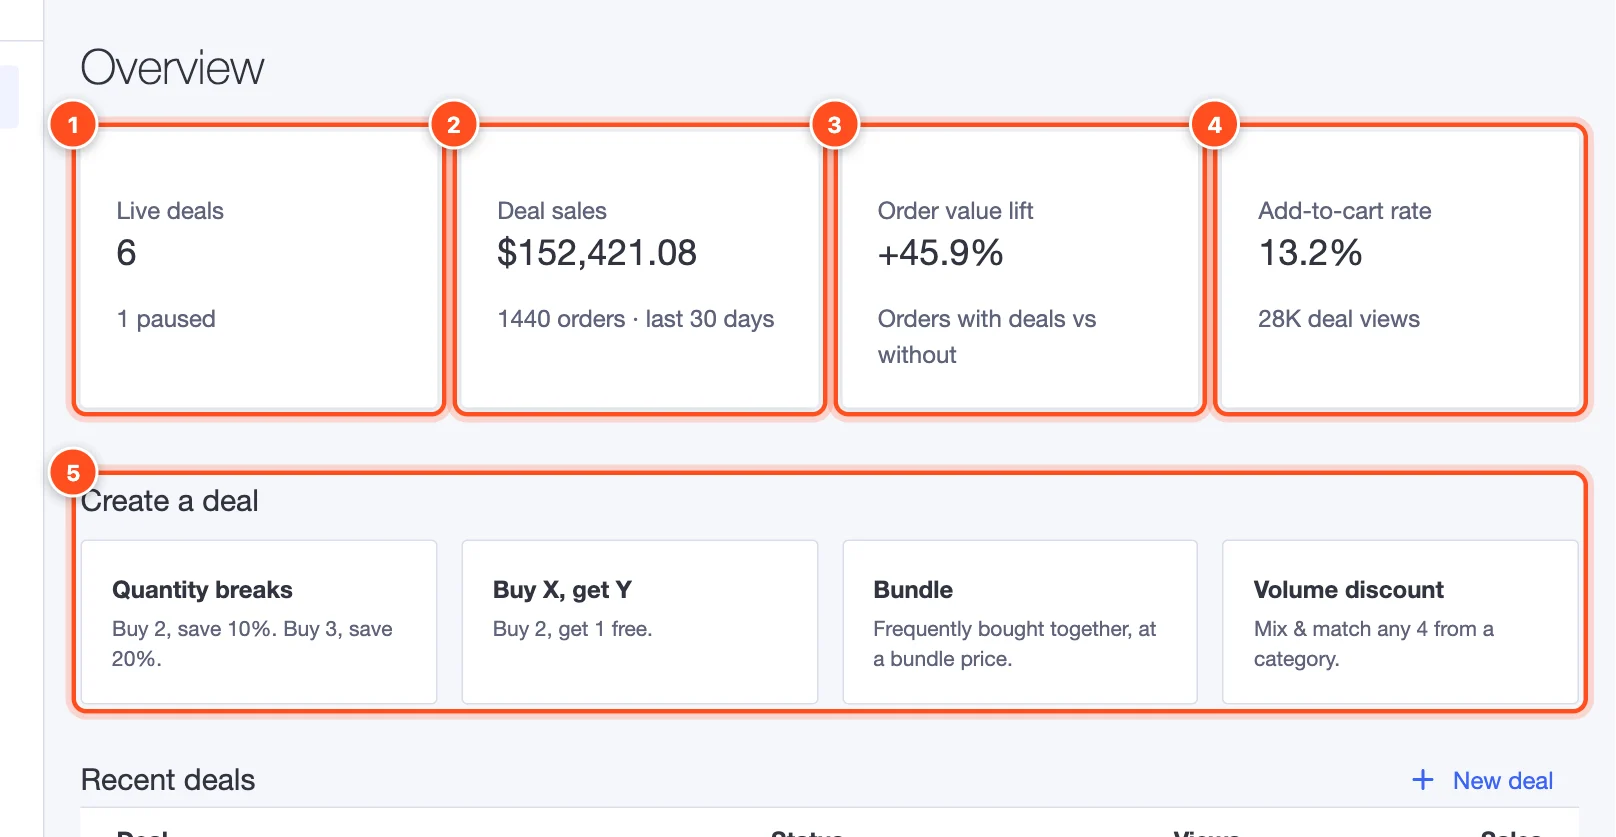
- Live deals — how many deals are live, and how many are paused.
- Deal sales — the value of orders with deals.
- Order value lift — how much bigger orders with deals are than orders without.
- Add-to-cart rate — how many shoppers who saw a deal added it to their cart.
- Create a deal — shortcuts to start a new deal of each type. Below them, your most recent deals.
For the full picture, open Analytics.
The headline numbers
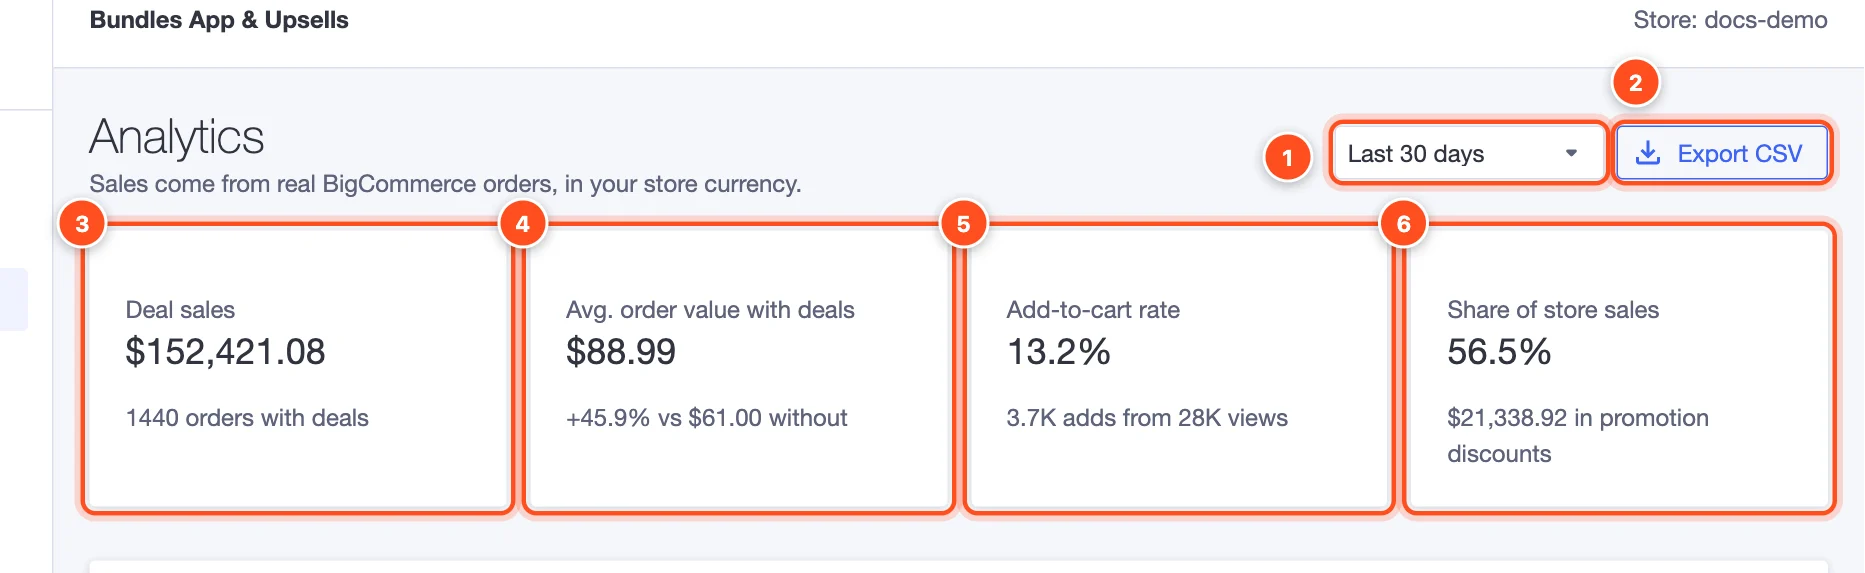
- Date range — the last 7, 30 or 90 days.
- Export CSV — download the numbers for a spreadsheet.
- Deal sales — the value of orders that included a deal, and how many orders that was.
- Avg. order value with deals — the average order value when a deal was used, compared with orders without one. This is the clearest measure of what the app adds: in the example, orders with deals are 45.9% bigger.
- Add-to-cart rate — out of the shoppers who saw a deal, how many added it to their cart.
- Share of store sales — how much of your store's revenue came from orders with deals, and how much you gave away in promotion discounts.
The chart
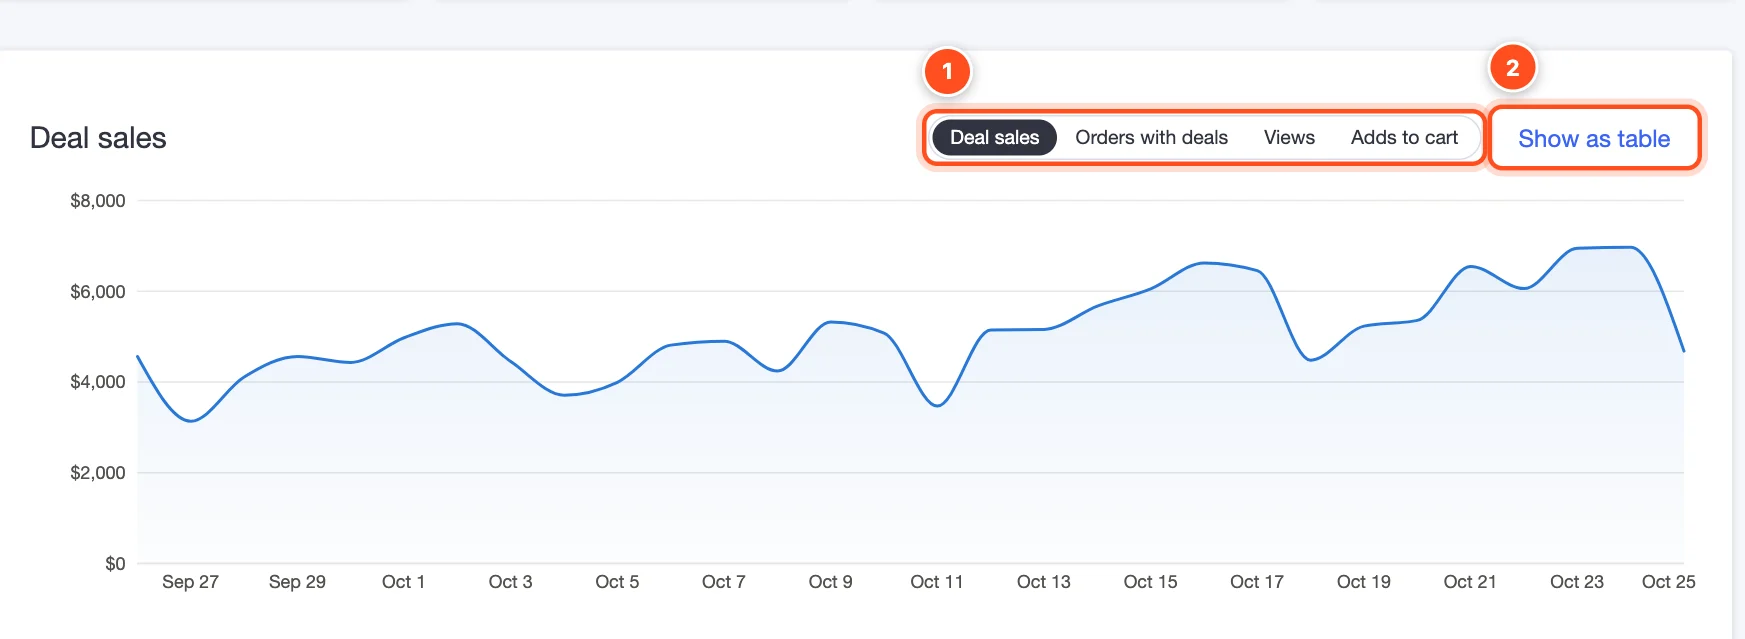
- Switch the chart between Deal sales, Orders with deals, Views and Adds to cart, day by day.
- Show as table — see the same numbers as a table.
Every deal, side by side
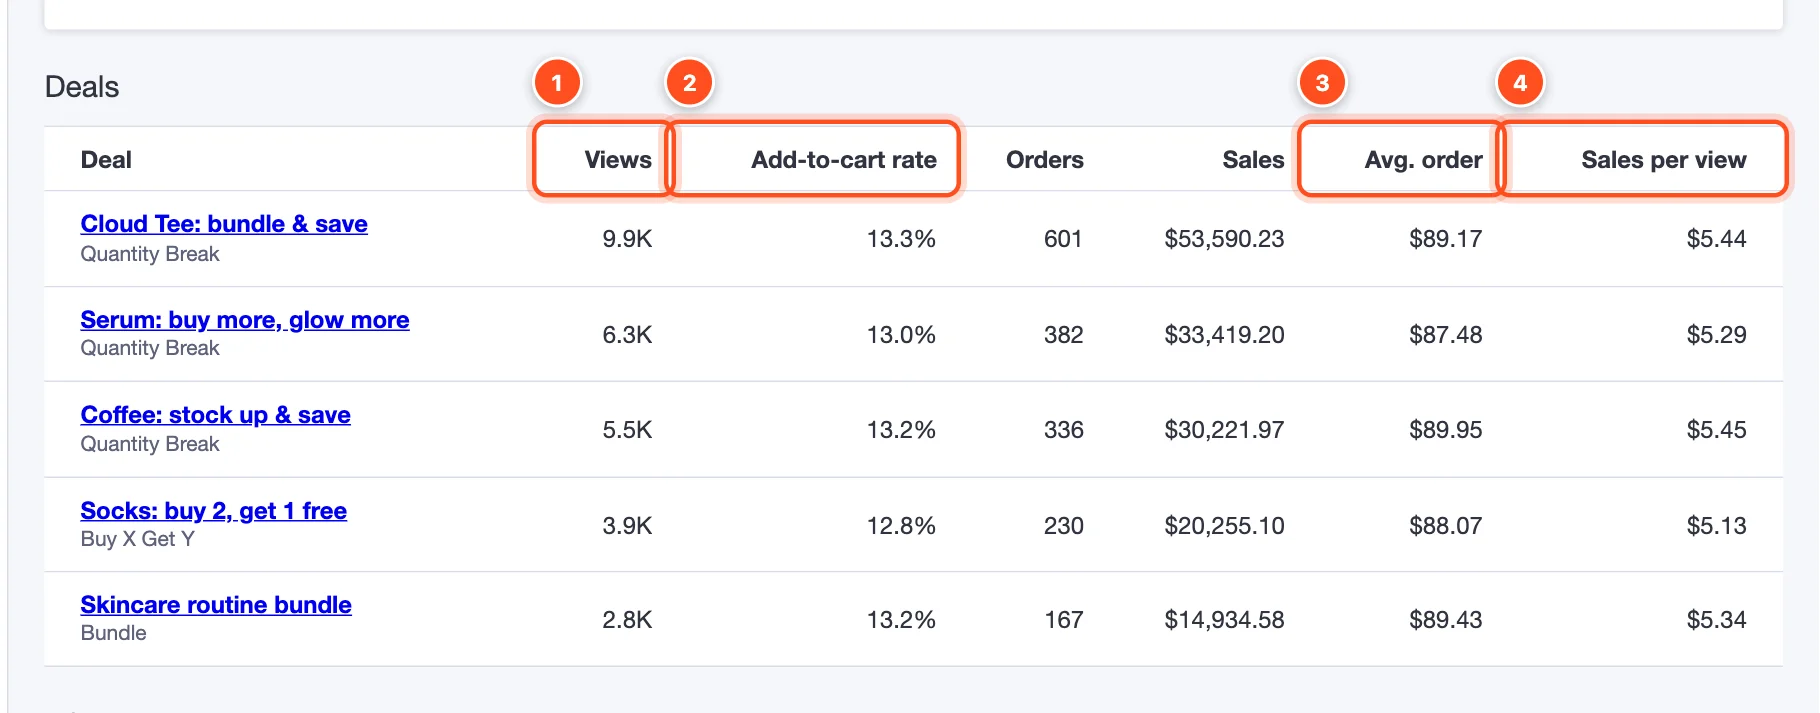
- Views — how many times shoppers saw the deal.
- Add-to-cart rate — views that turned into an add to cart. A good place to compare designs.
- Avg. order — the average order value for orders with this deal.
- Sales per view — sales divided by views. The single best number for comparing deals: it rewards deals that both convert and sell bigger orders.
Click a deal's name to open it in the editor.
A/B tests
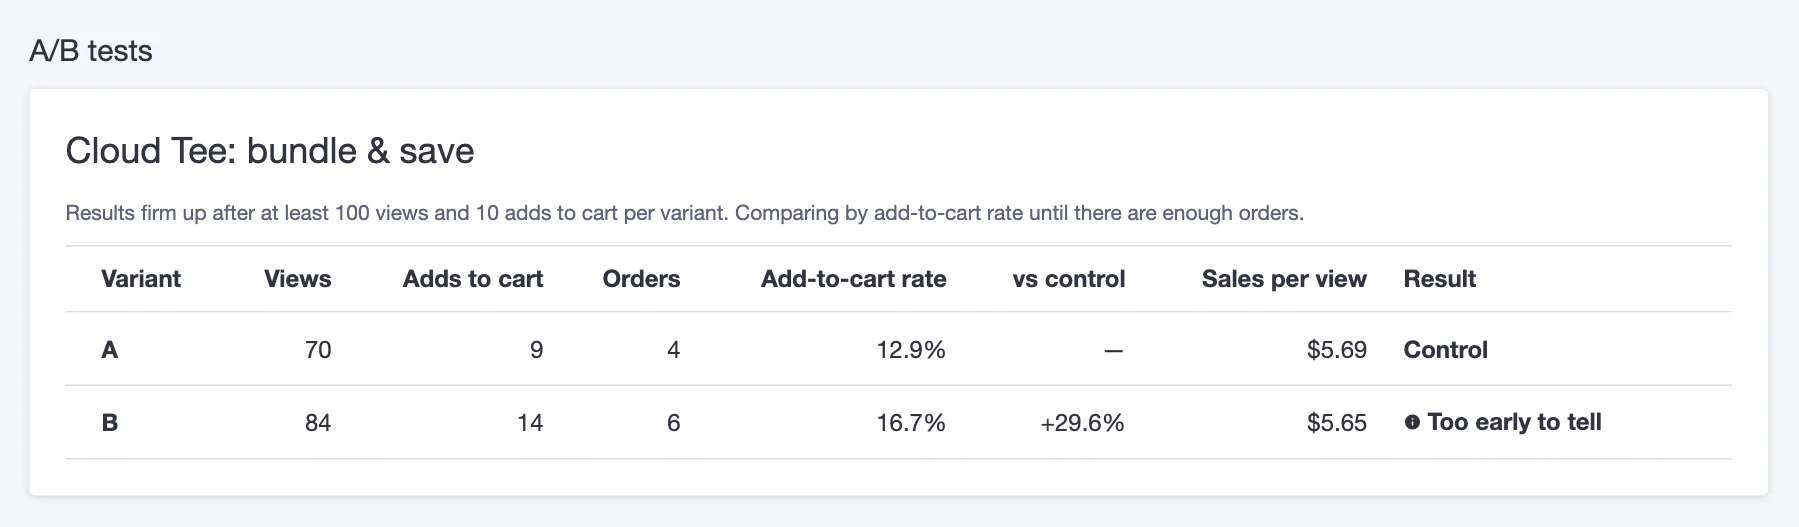
Running tests appear at the bottom of the page. See A/B testing for how to read them.
Turning numbers into action
| You notice… | Try… |
|---|---|
| Lots of views, low add-to-cart rate | A clearer style, a "Most popular" badge on your middle tier, or a bigger discount on it. A/B test the change. |
| Good add-to-cart rate, small orders | Add a bigger tier, or free gifts that unlock on bigger packs. |
| One deal far ahead on sales per view | Use the same setup on more products — duplicate it. |
| Promotion discounts are high | Check Combine with other promotions and Skip items already on sale under Offer → More options. |
Note: "Views" count every time a product page with the deal is shown. Plans are billed on additional revenue, which is different from deal sales — see Plans and billing.